by Teach2Tell
2nd – 6th Grade

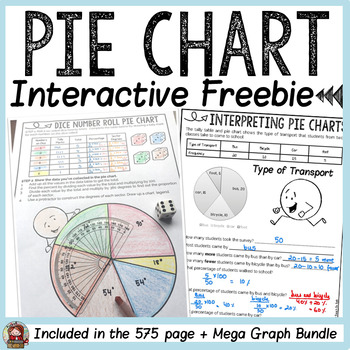
This freebie on interpreting and creating a pie chart is a sampler activity from the Mega Graphs Bundle.
ITEMS INCLUDED
✅ A poster defining a Pie Chart.
✅ A one-page activity sheet to interpret collated data on mode of transport to school.
✅ A one-page activity sheet that requires students to roll a dice and collect and interpret data. They will also find the percent and proportion of each sector to construct a pie chart using a protractor.
✅ Answer key/completed sample of each graphing activity.
**********************************************************************
⭐ RELATED RESOURCES
⚫ PIE CHARTS PRINT-N-GO SHEETS
⚫ PIE CHARTS 54 TASK CARDS (COLOR)
⚫ PIE CHARTS 54 TASK CARDS (BLACK AND WHITE)
⚫ OUR CLASS BAR GRAPHS COLLECTION : SURVEYS
⚫ MATH CURRICULUM: GRADES 4-6: GROWING BUNDLE
https://www.teacherspayteachers.com/Product/PIE-CHARTS-PIE-GRAPHS-CIRCLE-GRAPHS-FREEBIE-1031586
Join The Best of Teacher Entrepreneurs Marketing Cooperative at
https://thebestofteacherentrepreneursmarketingcooperative.net/the-best-of-teacher-entrepreneurs-marketing-cooperative-one-year-membership/
and get THOUSANDS OF PAGE VIEWS for your TpT products!
Victoria Leon’s TpT Store
Go to http://www.pinterest.com/TheBestofTPT/ for even more free products!
